
1. はじめに
ggppは、ggplotの機能を拡張してくれるパッケージです。特に、inset関係が強力です。
2. インストール
CRANからインストールできます。
install.packages("ggpp")3. つかってみる
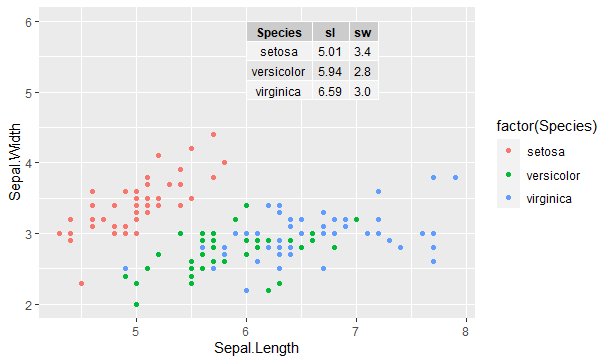
irisデータで散布図の中に種ごとの平均値を示す表を挿入しています。
library(ggpp)
library(ggrepel)
library(tidyverse)
head(iris)
tbl <- iris %>%
  group_by(Species) %>%
  summarize(sl = mean(Sepal.Length), sw = mean(Sepal.Width)) %>%
  ungroup() %>%
  mutate(sl = sprintf("%.2f", sl),
         sw = sprintf("%.1f", sw))
df <- tibble(x = 6, y = 6, tbl = list(tbl))
ggplot(iris, aes(Sepal.Length, Sepal.Width, colour = factor(Species))) +
  geom_point() +
  geom_table(data = df, aes(x = x, y = y, label = tbl))
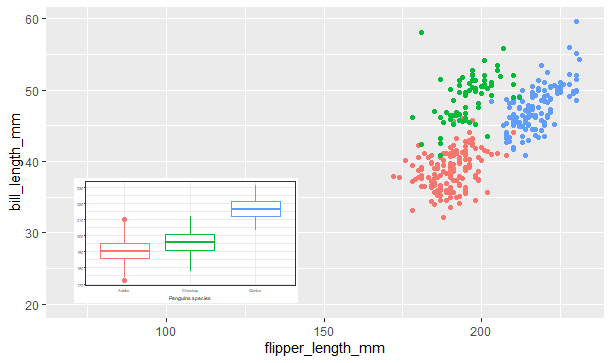
表ではなく、barplotを埋め込むこともできます。
library(palmerpenguins)
data(penguins)
p <- ggplot(penguins, aes(factor(species), flipper_length_mm, colour = factor(species))) +
  stat_boxplot() +
  labs(y = NULL, x = "Penguins species") +
  theme_bw(4) + theme(legend.position = "none")
ggplot(penguins, aes(flipper_length_mm, bill_length_mm, colour = factor(species))) +
  geom_point(show.legend = FALSE) +
  annotate("plot_npc", npcx = "left", npcy = "bottom", label = p) +
  expand_limits(y = 20, x = 70)
4. さいごに
insetがあるとより多くの情報を俯瞰できて表現力が高まりますね。このパッケージには、まだまだ機能があるようで鵜s。